The Economic Impact of CA’s Nonprofits
A Thriving Nonprofit Sector is Critical to California’s Economic Recovery

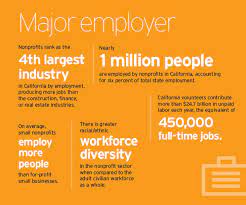
California’s nonprofit sector is among the state’s largest and most diverse employers.
- One in every 14 California jobs is at a nonprofit.
- The nonprofit sector is the state’s 4th largest industry byemployment -- more jobs than construction, real estate, finance, or entertainment sectors.
- More than 1.2 million people are employed by CA nonprofits.
- California volunteers contribute approximately $16.6 billion inunpaid labor each year, the equivalent of 331,058 full-time jobs, most of it in direct work with people, animals, and the land.
Compared with all other sectors, investments in California’s nonprofits can be counted on to:
- spend and hire in low-wealth communities - employ women and people of color
- bring dollars in from out-of-state
- provide services to communities
- For every paid job, nonprofits generate the economic output of another one-third FTE in volunteer time.
- Compared to the for-profit sector, nonprofits are substantially more diverse in race/ethnicity and gender.
o Women make up 73 percent of nonprofit management teams compared to 29 percent across all industries. o People of color make up 29 percent of nonprofit management compared to 12 percent across all industries.
California’s Nonprofit Economics
California’s nonprofit sector is a major contributor to the state economy and a primary government partner forproviding critical services to vulnerable Californians.
- For every $100 in California nonprofits, an additional $97 is generated through indirect and induced effects.
- In 2017, California’s nonprofit sector output of $237.7 billion was one-sixth of the Gross State Product.
- California nonprofits bring $40 billion each year into the state from out-of-state, by obtaining federal funding, grants from out-of-state foundations, and donations from individuals all over the world.
- Despite being exempt from paying corporate income tax, nonprofits pay more than $37 billion in taxes each year at federal, state, and local levels.
- California’s nonprofits are core to government services’ supply chain:
o One-third of all Medi-Cal services are delivered by nonprofits.
o Statewide, county contracts with nonprofits range from 1 to 14 percent of county budgets.
Disparities
Disparities in society are reflected in the nonprofit sector. Nonprofits are frequently located in and leaders in under-resourced communities and are uniquely able to leverage community assets.
- Some California counties have more than $14,000 in nonprofit revenue per capita (San Francisco) compared with others like Colusa County with just $97 per capita.
- The San Francisco Bay Area has 19 percent of the state’s population, but 35% of the state’s nonprofit revenue. By contrast, the Inland Empire and the San Joaquin regions each have 11% of the state’s population, but only 4 percent of total nonprofit revenue.
- Between 2012 and 2016, California nonprofits in communities of color (by zip code) had $1,668 in revenue per resident, while predominantly white communities had $3,123. Nonprofit assets per capita were $1,997 in communities of color and $6,006 in predominantly white communities.Source: “Causes Count: The Economic Power of California's Nonprofits,” California Association of Nonprofits, 2019 (updated edition) and 2014. Online at: https://calnonprofits.org/publications/causes-count
